

|
|
| Home | Services | Products | Order | Support | Contact |
Complete Decision Formulation, Analysis, and Presentation
This document provides a brief overview of some of the features available in Criterium DecisionPlus 3.0 (CDP 3.0)
Size Does Matter!
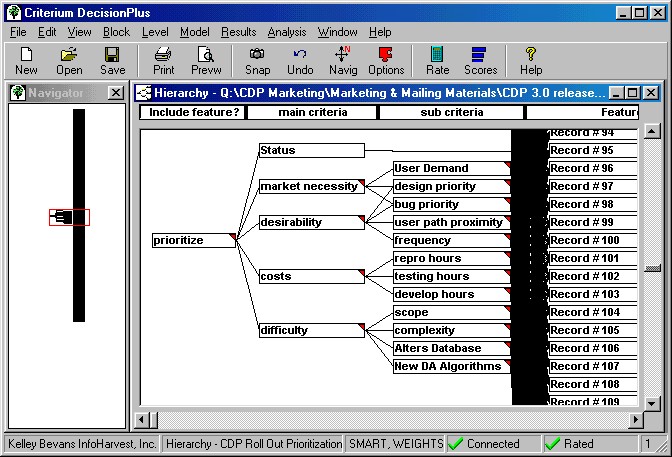
CDP 3.0 can hold up to 200 alternatives and 500 blocks in total. To accommodate greater numbers of alternatives, see our Weighted Decision Object (WDObj 4.0).
Now you can launch multiple sessions of CDP 3.0, so you can perform head-to-head comparisons of different models.
Tradeoffs are the key to verifiable decision-making
CDP 3.0 delivers the easiest interface to apply tradeoffs to complex hierarchical decision models.
In previous versions of CDP, your choice of weights and scales uniquely determined a set of tradeoffs and CDP represented these tradeoffs to you. The philosophy was that Tradeoff values gave numbers you could compare against standards you care about, such as, industry standards, historical norms, etc. Such comparisons would allow you and your fellow decision makers to validate (or invalidate) your preference weights.
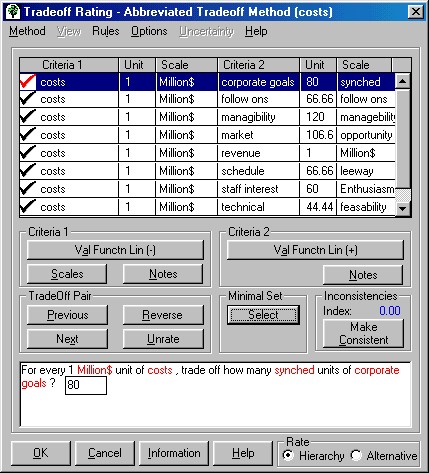
In CDP 3.0 you can now directly set the values for tradeoffs. Based on these values and the scales you have defined, CDP calculates the equivalent weights. It does this whether the model is a single layer model or a more complex multi-layer model. When first building a model, begin with the weights technique to capture preferences in the hierarchy, and, as the tradeoffs become apparent, switch to the tradeoffs technique to fine-tune your decision.
Models whose Hierarchy Method was set to Weights (e.g., all CDP Version 2.0 Models), and which were completely rated, will have their weight values converted to tradeoffs if the user changes the Hierarchy (rating) Method to Tradeoffs. Conversely, setting the Hierarchy Method to Weights will convert the tradeoffs back to weights. So, you can start with a weights approach, develop your scales and preferences, then, as you feel you are beginning to understand the key tradeoffs involved, edit those tradeoff values directly.
New Alternatives Scatter Plot
CDP 3.0 introduces the Alternatives Scatter Plot analysis feature. This plot helps you understand how your alternatives are distributed relative to their scores on the various lowest criteria. In addition, it also shows how the scatter of alternatives correlates with high decision scores.
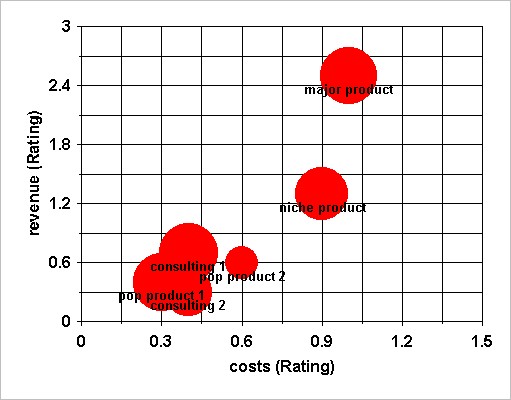
Alternatively, you can see how the decision contours are driven by particular lowest criteria:
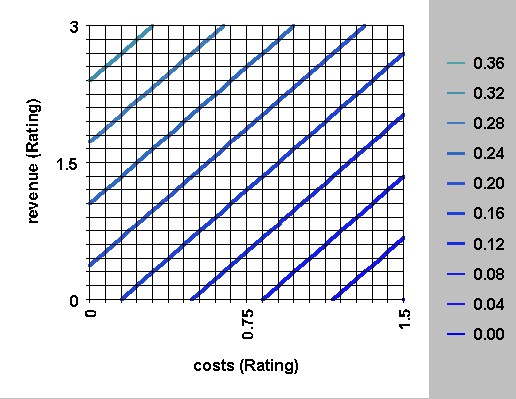
It is clear in the above example that all the alternatives (from the PROJECT by Tradeoffs.CDP sample model), are very close when the two most important criteria in the model, Revenues and Costs, are taken together.
Extension of Contributions to Criteria Analysis
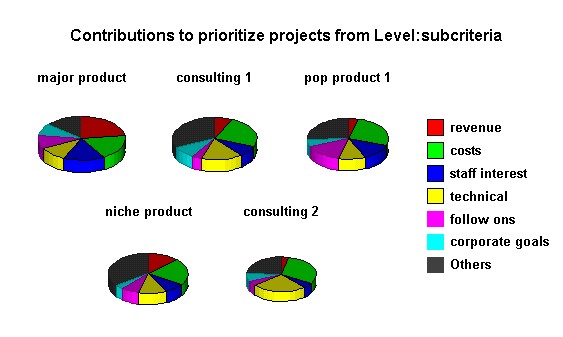
CDP 3.0 extends the Contributions by Criteria analysis to include other views that let you further examine the key characteristics of your decision. In addition to the original stacked bar chart, radar and repeated pie charts are now available.
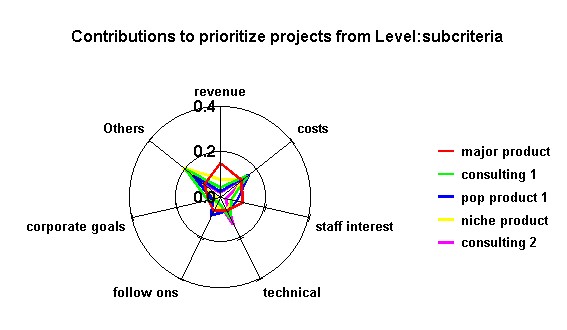
Radar graphs
In the above Radar graph it is clear that the alternative Major Product represents different value proposition than all the other alternatives. It is stronger than all other alternatives in terms of Revenues, Staff Interest and Corporate Goals but weaker than all other alternatives across all other Criteria.
Pie Graphs
Exporting Graphs as metafiles
These new graphs are powered by CDP 3.0's new graphics engine. With this engine, many of CDP 3.0ís anlyses (including the hierarchy structure itself) are exported as metafiles, so you can copy them into other Windows applications such as Microsoft Word.
Extensive Application Options available
In version 3.0 you can set a broad range of options governing everything from your default rating scales to how closely the blocks in the Hierarchy are drawn. This flexibility allows you to set defaults that makes CDP conform exactly to your process of decision-making.
|
InfoHarvest On-line Privacy Statement InfoHarvest Terms of Use |
Contact InfoHarvest © 1996-2023 InfoHarvest, Inc. |